MOSFET IV Characterization Visualizer
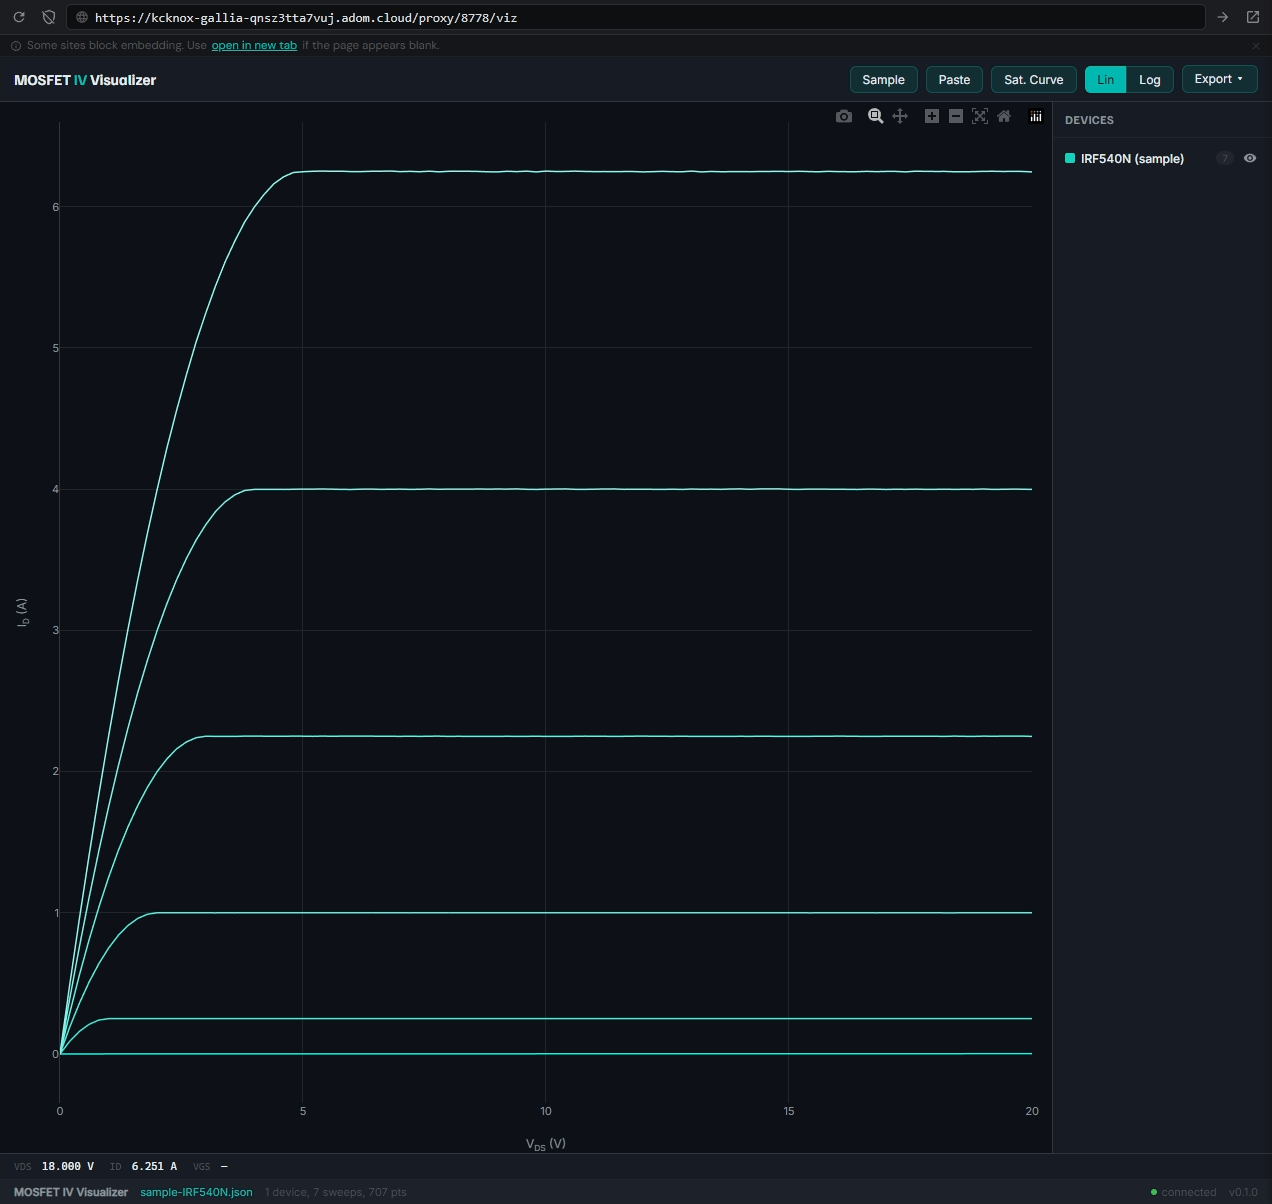
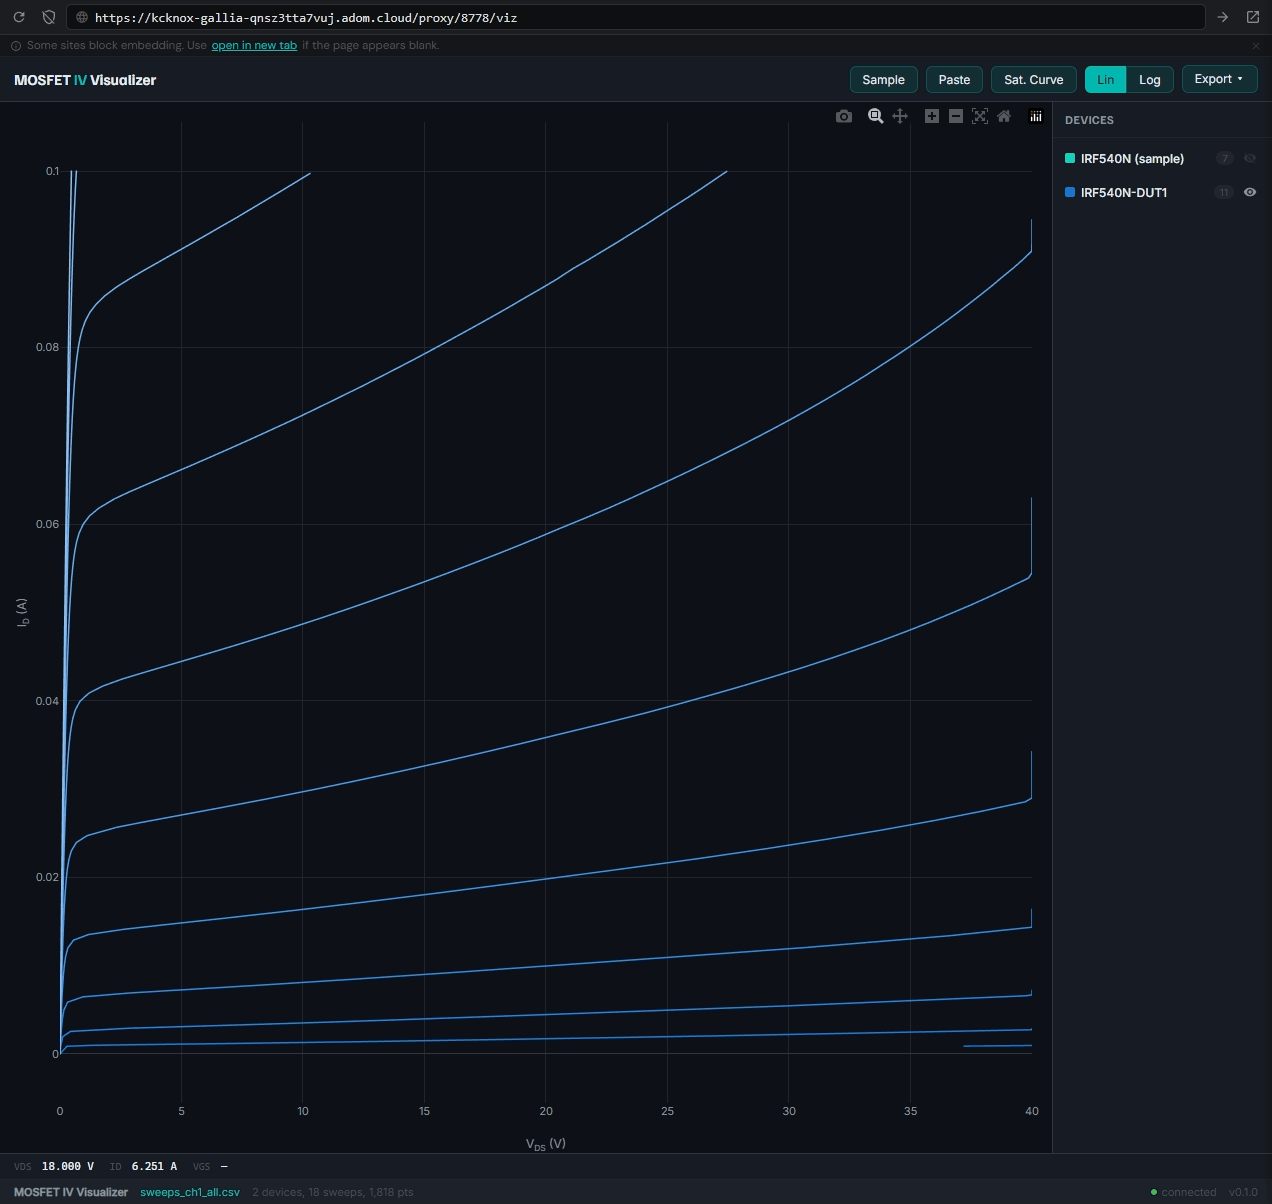
Interactive web-based visualizer for MOSFET IV curves. Plot Drain Current (Id) vs Drain-to-Source Voltage (Vds) with multiple gate voltage (Vgs) sweeps, overlay data from different devices, compute saturation boundaries, and extract device parameters.
Source: adom-inc/mosfet-visualizer
Installation
Clone from GitHub and start the server. Idempotent — safe to run multiple times.
INSTALL_DIR="/home/adom/mosfet-visualizer"

if [ -d "$INSTALL_DIR/.git" ]; then
  echo "[mosfet-visualizer] Updating..."
  cd "$INSTALL_DIR" && git pull origin main
else
  echo "[mosfet-visualizer] Installing..."
  git clone https://github.com/adom-inc/mosfet-visualizer.git "$INSTALL_DIR"
fi

cd "$INSTALL_DIR" && npm install --production
bash "$INSTALL_DIR/start-mosfet-visualizer.sh"
Verify: curl -sf http://127.0.0.1:8778/health
The service auto-starts via service.json if placed in $GALLIA_DIR/services/. No CLI binary needed — Claude uses the HTTP API directly.
Features
- Multiple Vgs sweep curves with per-sweep color coding
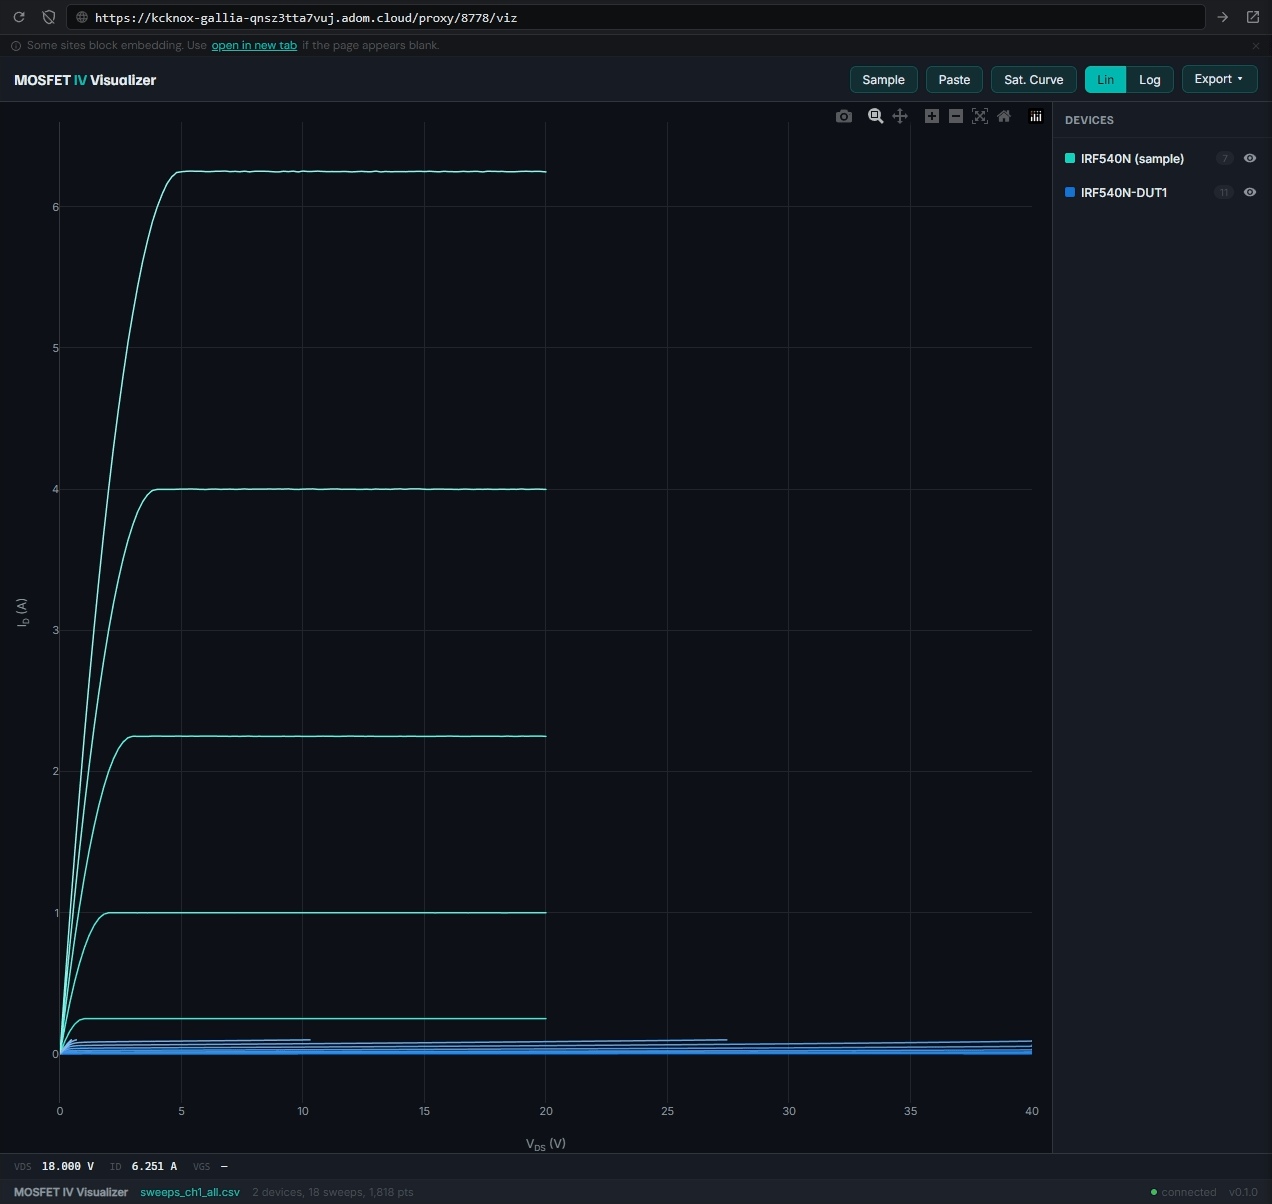
- Device overlay — compare multiple MOSFETs on the same chart
- Custom legend — eyeball toggle per device and per sweep, sweep count badges
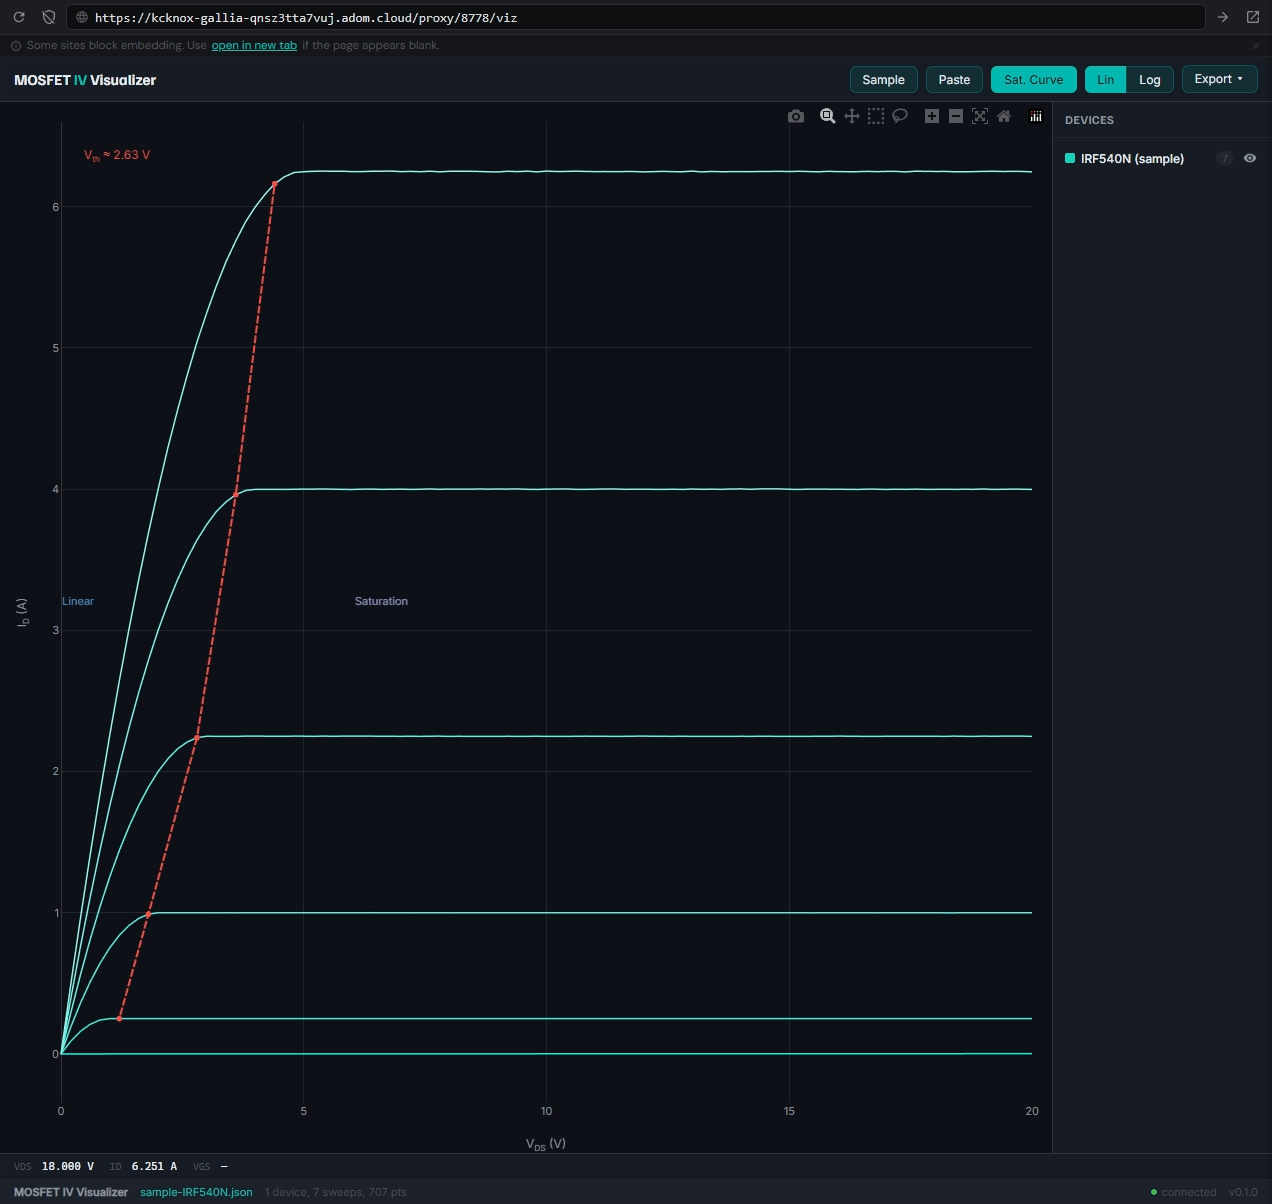
- Saturation boundary detection — compute the linear/saturation region boundary via knee detection algorithm
- Parameter extraction — threshold voltage (Vth), on-resistance (Rds_on)
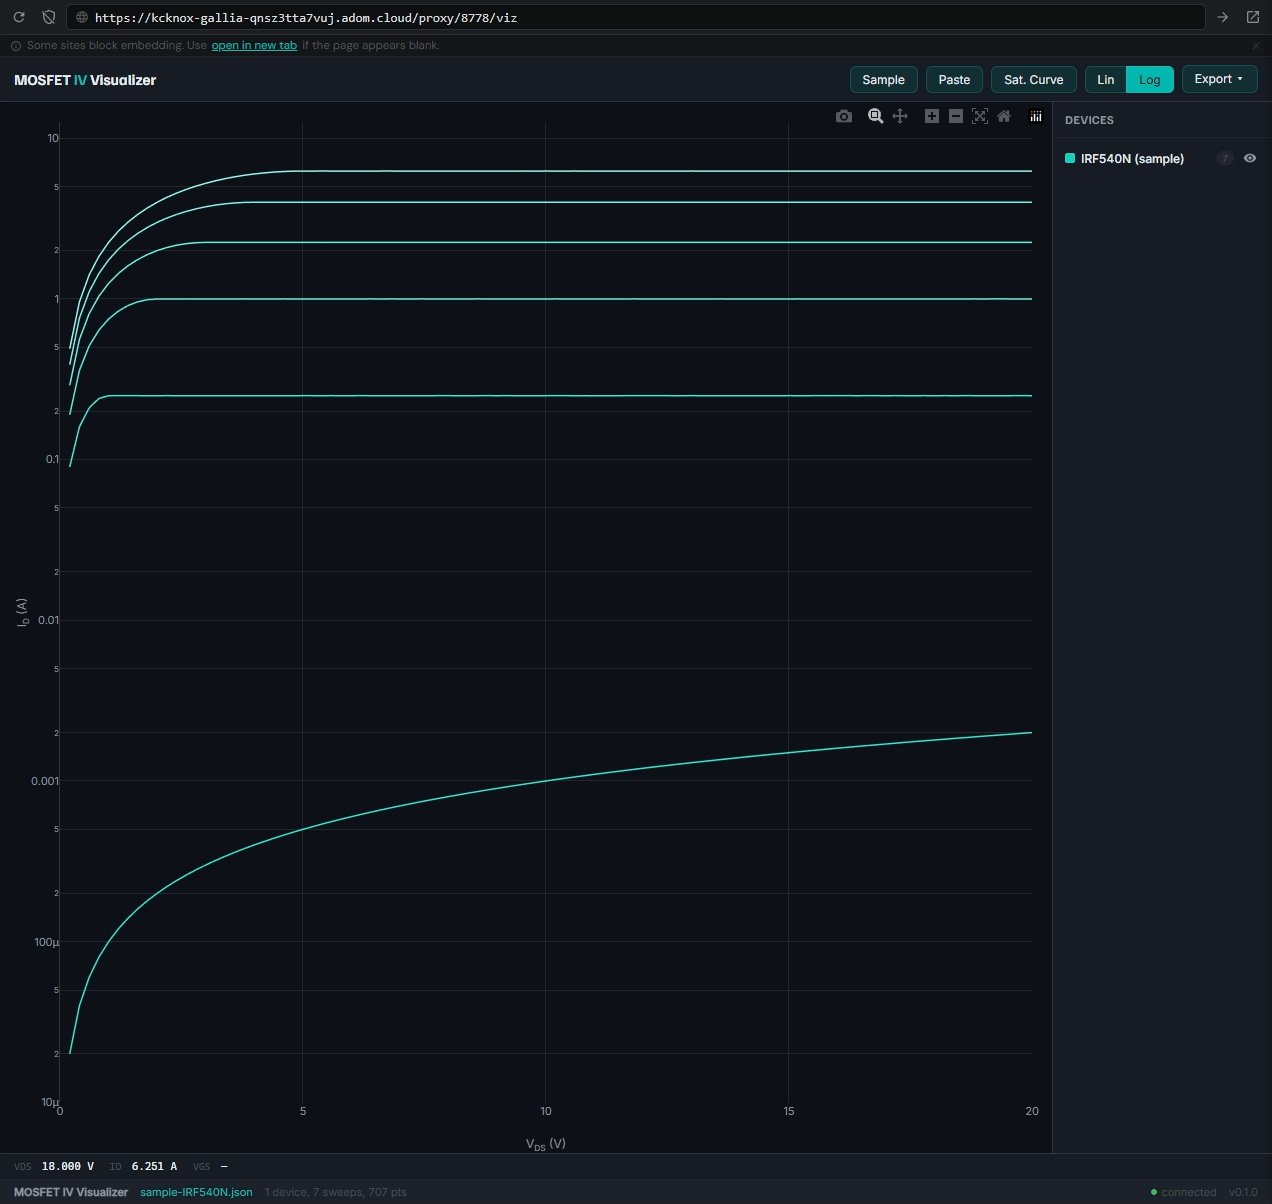
- Linear/Log scale toggle — essential for subthreshold characterization
- Crosshair cursor with hover tooltip showing exact Vds, Id, Vgs values
- Export — PNG, SVG, CSV, JSON
- CSV import — drag-and-drop curve tracer CSV files directly onto the chart
- Real-time API control — WebSocket pushes all state changes to the frontend instantly
- Shot log — monitor all API calls with timestamps and durations
Data Formats
JSON Sweeps
{
  "action": "plot",
  "device": { "id": "IRF540N", "name": "IRF540N", "type": "NMOS" },
  "sweeps": [
    { "vgs": 4.0, "data": [{ "vds": 0, "id": 0 }, { "vds": 5, "id": 0.5 }] }
  ]
}
Curve Tracer CSV
Column triplets per sweep: VN (V), IN (A), RN (Ohm) — auto-detected from headers.
AI Prompts
| Prompt | What it does |
|---|---|
| "Install the MOSFET IV visualizer" | Clones repo, installs deps, starts server |
| "Plot my MOSFET IV curves from this CSV file" | Reads CSV, sends to visualizer |
| "Show me the MOSFET visualizer with sample data" | Starts server, loads demo, opens panel |
| "Compute the saturation boundary curve" | Runs knee finder, draws red dashed parabola |
| "What's the threshold voltage?" | Analyzes data, extracts Vth |
| "Switch to log scale" | Toggles Y-axis to log10 |
| "Overlay my BSS138 data on the IRF540N" | Adds second device for comparison |
Keyboard Shortcuts
| Key | Action |
|---|---|
| L | Toggle linear/log scale |
| K | Compute/clear saturation curve |
| S | Load sample data |
| R | Reset zoom |
Architecture
- Server: Node.js HTTP + WebSocket (port 8778)
- Frontend: Self-contained HTML with Plotly.js
- Brand: Adom dark theme (teal #00b8b0)
- No CLI needed — Claude reads the skill and uses
curlto control the API