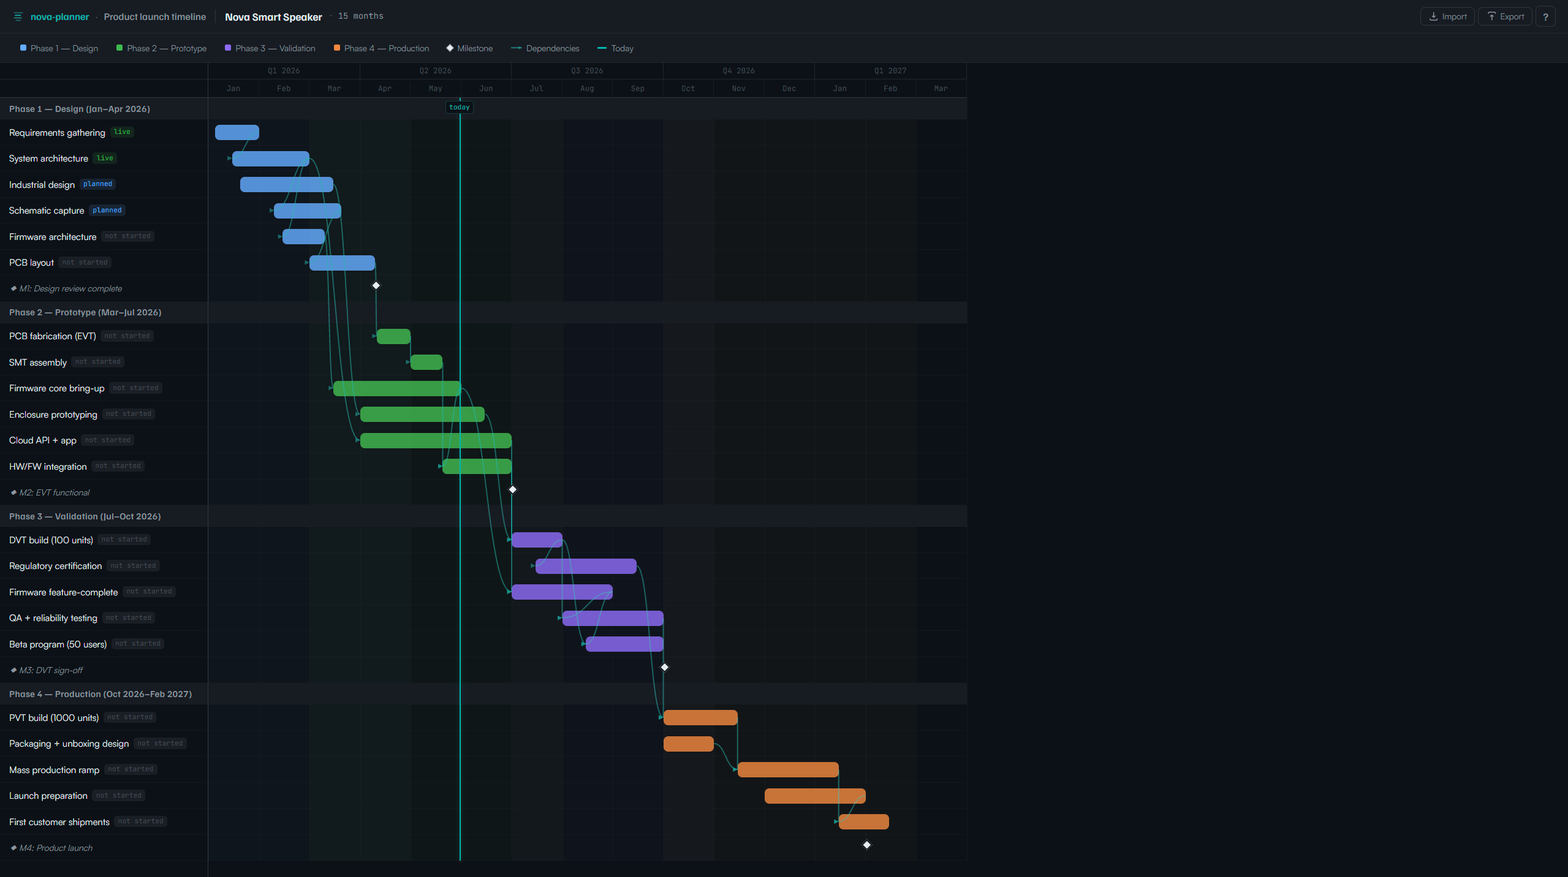
Interactive Gantt chart viewer for project timelines. Drop in a JSON data file and get a fully editable, dark-themed timeline with dependency arrows, multi-select batch editing, import/export, and auto-save.
Install
# Clone the repo
gh repo clone adom-inc/adom-gantt ~/project/adom-gantt

# Run with your data file
node ~/project/adom-gantt/server.js --data my-project.json --port 8901
Features
- Click-to-edit dates and dependencies
- Ctrl+click / Shift+click multi-select with relative batch shifting
- Drag bar edges to resize, drag body to move, drag vertically to reorder
- Dependency arrows with incoming/outgoing visibility
- Legend click-to-filter by phase, milestone, or dependencies
- Import from JSON, CSV, MS Project XML, Jira CSV
- Export to JSON, CSV, SVG, self-contained HTML
- Ctrl+Z undo (100 levels) for all operations including reorder
- Auto-save to sidecar JSON file
- Dynamic date range and live today marker
Data format
See the SKILL.md for the full JSON schema reference. Two example datasets are included.